Financials
UNAUDITED CONDENSED INTERIM CONSOLIDATED FINANCIAL STATEMENTS & RELATED ANNOUNCEMENT FOR THE SIX MONTHS & FULL YEAR ENDED 31 DECEMBER 2025
Financials Archive![]() Note: Files are in Adobe (PDF) format.
Note: Files are in Adobe (PDF) format.
Please download the free Adobe Acrobat Reader to view these documents.
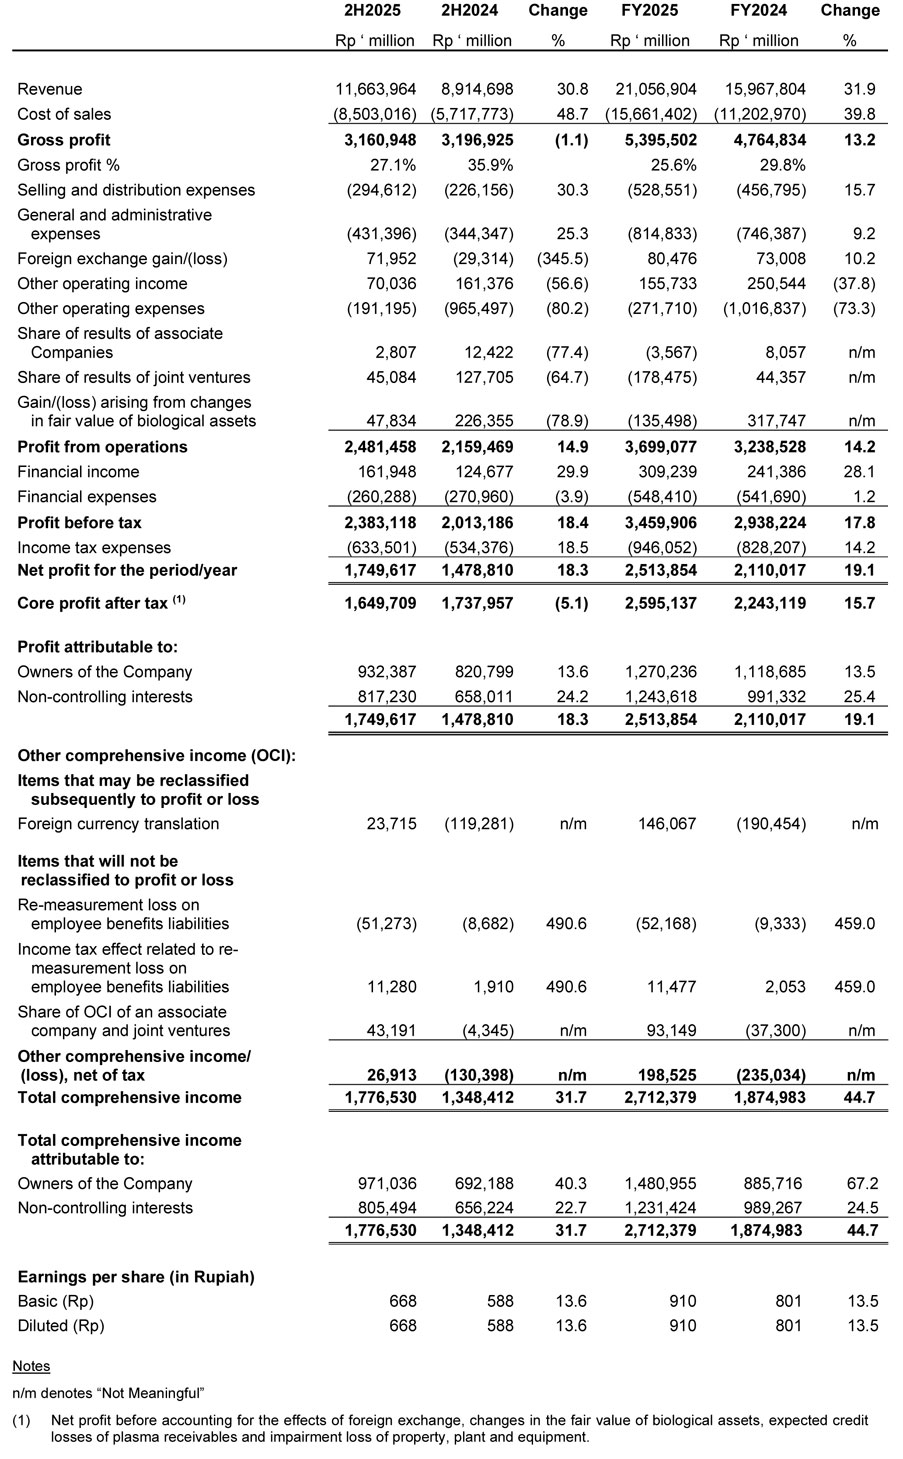
Condensed Interim Consolidated Statement of Comprehensive Income
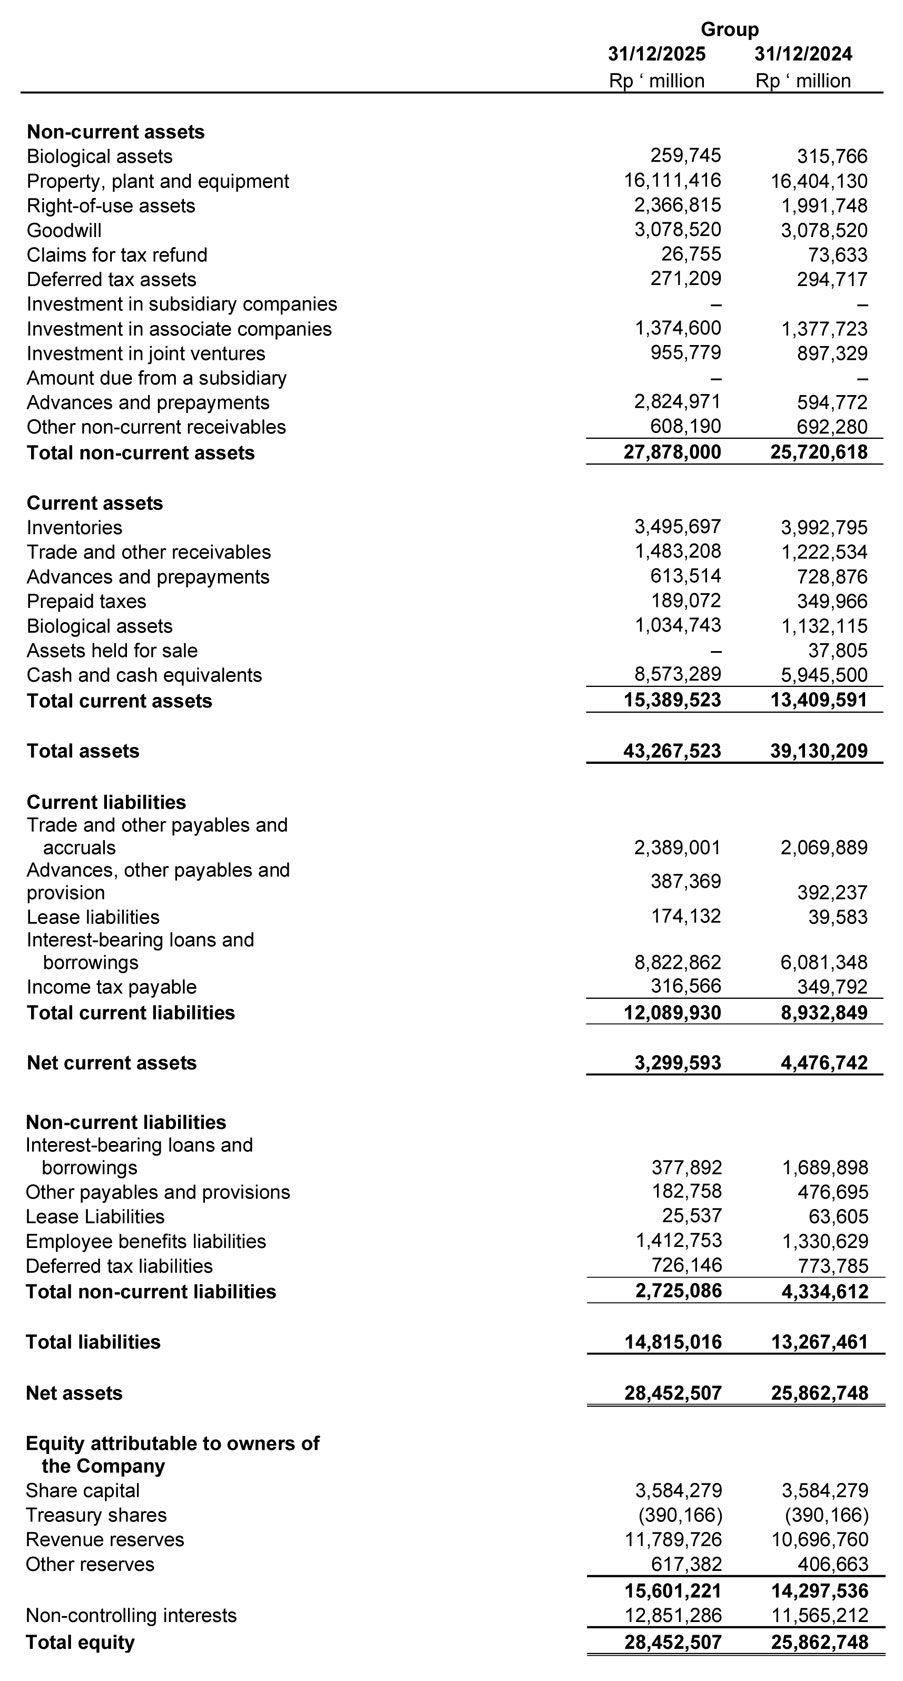
Condensed Interim Statements of Financial Position
Review of performance of the Group
Financial Performance
Overview: : CPO prices in 2025 were supported by tightened supply and strong demand from Indonesia’s biodiesel program. Domestic CPO (KPB) increased 8% to an average of Rp14,236 per kg, while international prices (CIF Rotterdam) rose 15% to USD 1,283 per tonne. Higher coconut oil prices supported palm kernel’s competitiveness, and the rise in palm kernel prices contributed to the Group’s results.In contrast, raw sugar prices (NYMEX No. 11) declined from a peak of 24 US cents per pound in 2024 to about 15 US cents per pound by the end of 2025, driven by higher production in Brazil, India and Thailand, as well as softer demand. Our sugar operations in Brazil were impacted by weaker raw sugar prices.
In 2H2025, the Group achieved revenue growth of 31% on higher selling prices and increased volume across both Plantation and EOF Divisions. However, gross profit declined 1% mainly due to higher palm production costs and raw material costs in the EOF Division. Nevertheless, net profit after tax improved 18% over last year, driven mainly by lower other operating expenses and forex exchange gains. This was partly offset by increased selling and general administrative expenses, lower other operating income, lower profit contribution from joint ventures, lower fair value gains on biological assets, as well as higher income tax expenses in line with higher profit.
On a full-year basis, the Group delivered an improved set of results with higher revenue and profit. Total sales grew 32% to Rp21.1 trillion in 2025 on higher selling prices and volumes. Net profit after tax improved 19% to Rp2.5 trillion, reflecting higher gross profit and factors similar to those in 2H2025.
Segment Overview: The Plantation Division's FFB nucleus production declined by 4% in 2H2025, resulting in a 2% decline for FY2025. Nonetheless, FY2025 CPO production rose 4% to 733,000 tonnes mainly driven by higher FFB purchases from external parties.
The Plantation Division’s revenue increased by 14% in 2H2025 and 21% in FY2025, mainly due to higher sales volume and selling prices of palm products. 2H2025 operating profit declined 5% mainly due to higher palm production costs and lower fair value gains on biological assets, partly offset by reduced other operating expenses. On a full-year basis, this division reported a 7% increase in operating profit mainly attributable to higher gross profit and lower other operating expenses. This was partly offset by fair value loss on biological assets in FY2025.
The EOF Division remained profitable with higher sales of edible oils and fats products. This was achieved through competitive pricing strategies while ramping up advertising and promotions. Revenue rose by 23% and 22% in 2H2025 and FY2025, driven mainly by higher sales volume and selling prices, while operating profit declined 4% in 2H2025 and 6% in FY2025, largely due to lower income from the sale of export allocation rights.
Revenue: The Group’s consolidated revenue (after elimination of inter-segment sales) in 2H2025 and FY2025 increased 31% and 32% over the same periods last year, mainly due to higher revenue recorded by both Plantation and EOF Divisions. The Plantation Division sold 82% of its CPO to EOF Division in FY2025 compared to 94% in FY2024.
Cost of sales: The increase in cost of sales of 49% in 2H2025 and 40% in FY2025 was driven mainly by higher palm production costs arising from higher fertiliser application and purchases of fresh fruit bunches from external parties, as well as higher raw material costs.
Gross profit: In 2H2025, gross profit decreased 1% mainly as a result of higher palm production costs. On a full year basis, gross profit improved 13% on stronger revenue, but this was partially offset by higher production costs
Selling and distribution expenses (S&D): S&D expenses increased 30% in 2H2025 and 16% in FY2025, reflecting higher freight and distribution costs from increased sales volumes and higher advertising and promotion expenses.
General and Administrative Expenses (G&A): G&A expenses increased 25% in 2H2025 and 9% in FY2025 mainly due to higher salary and benefit costs.
Foreign Exchange Gain/(Loss): The Group recognised foreign currency gains of Rp80 billion and Rp73 billion in FY2025 and FY2024 mainly due to the translation of US dollar-denominated assets (i.e. cash) as of the respective year-end exchange rates. These foreign currency gains were mainly due to the weakening of the Indonesia Rupiah against the US Dollar.
Other Operating Income: Lower other operating income in 2H2025 and FY2025 was mainly due to lower proceeds from the sale of export allocation rights.
Other Operating Expenses: The significant decrease in other operating expenses in 2H2025 and FY2025 was mainly due to lower provision for plasma receivables, as well as lower impairment loss and write-off of property, plant and equipment.
Share of Results of Joint Ventures (JVs): In FY2025, the Group recorded a JVs loss of Rp178 billion, compared with a profit of Rp44 billion in FY2024. The decline was mainly attributable to lower crushing volume following severe drought conditions in the previous year, leading to reduced raw sugar volume. The performance was also affected by lower raw sugar prices, higher fair value losses on biological assets, and higher finance expenses.
Gain/(Loss) arising from Changes in Fair Values of Biological Assets: : In FY2025, the Group recognised a loss from changes in fair value of biological assets of Rp135 billion compared to a gain of Rp318 billion in FY2024. The loss in FY2025 was mainly due to lower FFB production and prices, as well as higher production cost. While the gain in FY2024 was mainly due to higher FFB prices.
Profit from Operations: The Group reported higher profit from operations of 15% in 2H2025 and 14% in FY2025.
Financial income: Higher finance income in FY2025 was mainly due to higher cash position.
Income Tax Expenses: The Group recognised higher income tax expenses in 2H2025 and FY2025 mainly attributable to higher corporate income tax in line with higher profit.
Net Profit After Tax (NPAT):The Group recorded higher NPAT of 18% in 2H2025 and 19% in FY2025, primarily due to higher operating profit and higher financial income, partly offset by increased income tax expenses.
Review of Financial PositionAs at 31 December 2025, the Group reported total non-current assets of Rp27.9 trillion, compared to Rp25.7 trillion as at 31 December 2024. The increase was mainly due to higher right-of-use assets arising from the renewal of land lease for a refinery, increased advances for projects, as well as forestry administrative charges, which have been deferred pending the outcome of an appeal. This was partly offset by depreciation and write-off of property, plant and equipment, as well as lower plasma receivables.
The Group’s total current assets stood at Rp15.4 trillion as at 31 December 2025, up from Rp13.4 trillion as at 31 December 2024. The increase was driven by increases in trade and other receivables and cash levels. This was partly offset by lower CPO inventories and finished products in the EOF division, along with decreases in advances for raw material purchases, prepaid taxes and biological assets.
As at 31 December 2025, the Group’s total liabilities increased 12% to Rp14.8 trillion mainly due to higher interest-bearing loans and borrowings, trade and other payables and lease liabilities. This was partly offset by lower amounts due to related parties and deferred tax liabilities.
The Group recorded net current assets of Rp3.3 trillion as at 31 December 2025, compared to Rp4.5 trillion in the previous year-end. The Group’s financial position remained positive, supported by higher cash levels in Lonsum. The Group’s net debt-to-equity ratio improved, decreasing from 0.07 times in the prior year to 0.02 times as at 31 December 2025.
Review of Cash FlowsThe Group reported higher net operating cash flows of Rp3.4 trillion in 2025, compared to Rp2.2 trillion in 2024 due to improved operating results and working capital.
In 2025, the Group recorded 8% increase in investing activities to Rp1.5 trillion, primarily driven by higher additions to property, plant and equipment and biological assets, as well as the absence of dividends from a joint venture.
In terms of financing activities, the Group recorded net cash inflow of Rp0.7 trillion in 2025, compared to a cash usage of Rp0.1 trillion in 2024. This was mainly due to drawdowns of loan facilities to pay for forestry administrative charges of Rp2.3 trillion. This was partly offset by advance payment for a land lease renewal and higher dividend payment.
As of 31 December 2025, the Group’s cash levels increased to Rp8.6 trillion from Rp5.9 trillion a year ago, mainly due to positive operating free cash flows from Lonsum.
Commentary
Looking ahead to 2026, commodity prices are expected to remain volatile, influenced by supply and demand dynamics, as well as increasingly by weather patterns and geopolitical risks. As a price taker we will continue to focus on targeted action plans to improve operational outcomes, strengthen cost controls, drive agronomic innovations and prioritise capex in critical areas.
In 4Q 2025, we have completed the expansion of our Tanjung Priok refinery by adding a third production line, which is capable of processing up to 450,000 tonnes of CPO per year. Leveraging on expanded refining capacity and advanced technologies in the EOF Division, the Group plans to increase sales volumes through competitive pricing, strengthen distribution networks and ensure consistent product availability to support Indonesia’s growing consumer and industrial markets.