SEO Version


precision agronomy for
sustainable growth
With limited land for expansion andmounting environmental
concerns, improving the yield of current planted areas has
become a sustainable way of addressing the increasing
food demand while keeping price competitive.
We are using precision agronomy as a means to improve
the efficiency of the plantations. By using Global Positioning
System (GPS) technology and mobile tracking and sensor
devices, we are able to analyse and enhance the yield
exploitation of the estates block-by-block. For IndoAgri,
precision agronomy is one key tool to improve yield
exploitation and reduce argochemicals input for each
30-hectare block through specific strategies on fertiliser
recommendations, pest control and disease as well as
weed management.
deployment of geographic
information system (GIS)
We make use of GPS surveys and remote sensing
technology to generate detailed 2D and 3D topographic
maps, and GIS tools to analyse the GPS yield and crop
data to ensure optimum plantation management. GIS
is a database system for organising, storing, retrieving,
displaying and analysing GPS spatio-temporal data.
The time-series yield map of the GIS simplifies the large
database and allows us to quickly visualise and analyse
the variables affecting yield and sustainability, such
as soil type, land productivity classes, palm nutrient
status, pest and disease status and management. The
GIS has helped the plantations make on-time informed
and better decisions.
nutrition management
IndoAgri has detailed soil survey maps that support site-
specific, agronomic block management. Soil maps are
created after a field survey of the spatial distribution of
major soil types and soil fertility levels in the estates. The
soil survey maps are consulted for various aspects of
estate management, such as soil and water conservation
methods, fertilisation and weed management.
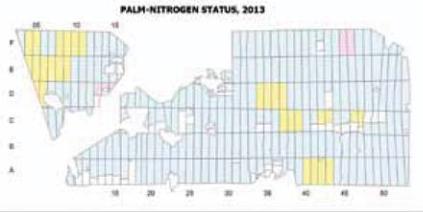
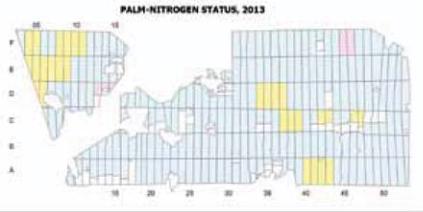
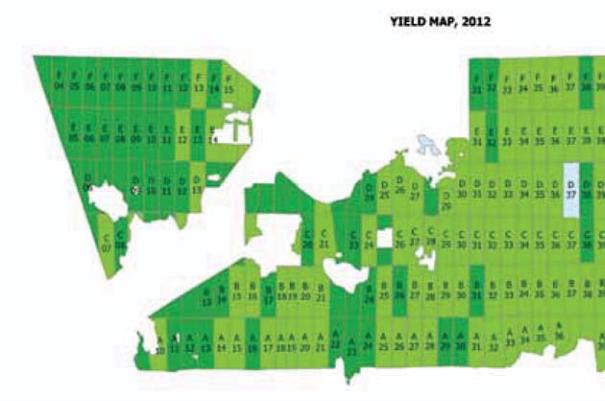
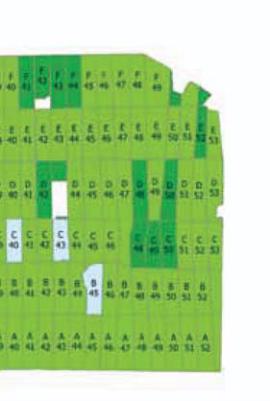
For our nutrition management system, we use among
others, GIS-based topical views of the oil palm plantation
to map the soil fertility and palm nutrient levels against
yield. The Lubuk Raja Estate example above illustrates the
maps of FFB yields. In relation to the maps of the status
of two of the macronutrients: nitrogen and phosphorus.
The oil palm nutrient status is monitored annually to
ensure optimal fertilisation and yield per block.
innovation in sustainability
Sustainability Report 2 012
43
Powered by FlippingBook Publisher